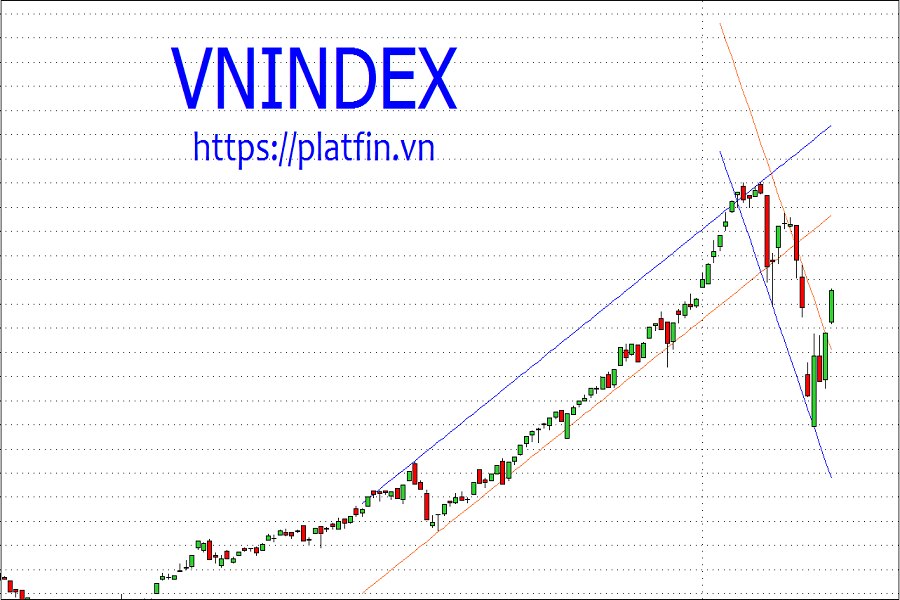
Kênh đường giá tự động dành cho Amibrocker
Code kênh đường giá tự động dành cho phần mền phân tích AmiAmibrocker được cung cấp bởi platfin và một trong những code chart tự động giúp nhà đầu tư có hướng đi của thị trường một cách tự động.
_SECTION_BEGIN("Price");
SetChartOptions(0,chartShowArrows|chartShowDates);
_N(Title = StrFormat("{{NAME}} - {{INTERVAL}} {{DATE}} Open %g, Hi %g, Lo %g, Close %g (%.1f%%) {{VALUES}}", O, H, L, C, SelectedValue( ROC( C, 1 ) ) ));
Plot( C, "Close", ParamColor("Color", colorDefault ), styleNoTitle | ParamStyle("Style") | GetPriceStyle() );
_SECTION_END();
_SECTION_BEGIN("Pattern Recognition Exploration 3");
GfxSetOverlayMode(1);
GfxSelectFont("Tahoma", Status("pxheight")/12 );
GfxSetTextAlign( 6 );
GfxSetTextColor( ColorRGB( 0, 0, 255 ) );
GfxSetBkMode(1); // transparent
GfxTextOut( Name(), Status("pxwidth")/2, Status("pxheight")/18 );
GfxSelectFont("Candara", Status("pxheight")/12 );
GfxSelectFont("Candara", Status("pxheight")/24 );
GfxTextOut( "https://platfin.vn", Status("pxwidth")/2, Status("pxheight")/5.5 );
x = Cum(1);per = 3;s1=L;s11=Hh;
pS = TroughBars( s1, per, 1 ) == 0;
endt= LastValue(ValueWhen( pS, x, 1 ));
startt=LastValue(ValueWhen( pS, x, 2 ));
dtS =endt-startt;
endS = LastValue(ValueWhen( pS, s1, 1 ) );
startS = LastValue( ValueWhen( pS, s1, 2 ));
aS = (endS-startS)/dtS;bS = endS;
trendlineS = aS * ( x -endt ) + bS;
Plot(IIf(x>startt-10,trendlineS,-1e10),"",colorBlue,1);
H1=LastValue(Highest((Cum(1)>startt AND Cum(1) tH1=LastValue(ValueWhen(H==H1,Cum(1)));
Color=IIf((Cum(1)==startt OR Cum(1)==endt),colorBlue,IIf(Cum(1)==tH1,colorOrange,colorBlack));
Plot(C,"Close",Color,64);
UpperParallel=aS*(x-tH1)+H1;Plot(IIf(x>startt-10,UpperParallel,-1e10),"UpperLine",colorOrange,1);
x = Cum(1);per = 3;s1=L;s11=H;
pR = PeakBars( s11, per, 1 ) == 0;
endt1= LastValue(ValueWhen( pR, x, 1 ));
startt1=LastValue(ValueWhen( pR, x, 2 ));
dtR =endt1-startt1;
endR = LastValue(ValueWhen( pR, s11, 1 ) );
startR = LastValue( ValueWhen( pR, s11, 2 ));
aR = (endR-startR)/dtR;
bR = endR;
trendlineR = aR * ( x -endt1 ) + bR;
Plot(IIf(x>startt1-10,trendlineR,-1e10),"",colorBlue,1);
L1=LastValue(Lowest(IIf(Cum(1)>startt1 AND Cum(1) tL1=LastValue(ValueWhen(L==L1,Cum(1)));
Color=IIf((Cum(1)==startt1 OR Cum(1)==endt1),colorBlue,IIf(Cum(1)==tL1,colorOrange,colorBlack));
Plot(C,"Close",Color,64);
LowerParallel=aR*(x-tL1)+L1;Plot(IIf(x>startt1-10,LowerParallel,-1e10),"LowerLine",colorOrange,1);
_SECTION_END();
TIN TỨC NỔI BẬT


BÁO CÁO PHÂN TÍCH